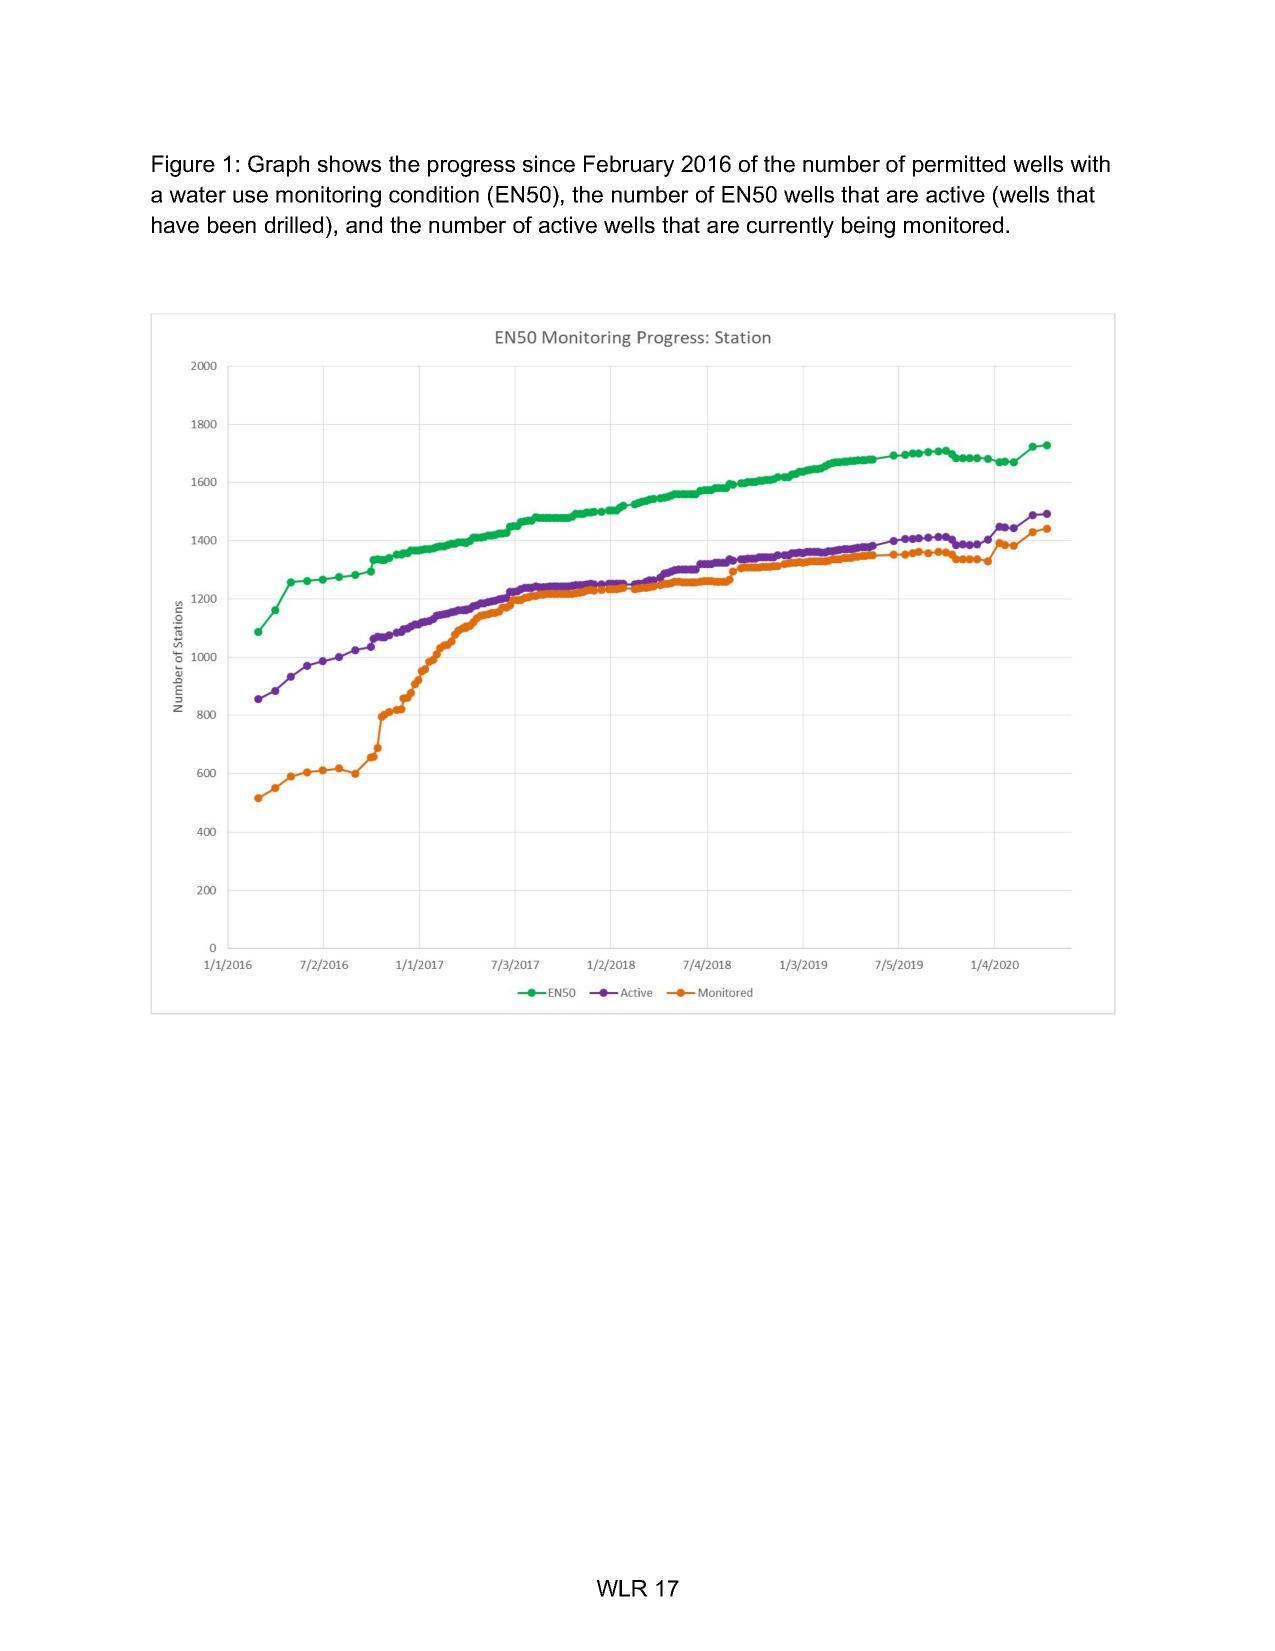
Figure 1: Graph shows the progress since February 2016 of the number of permitted wells with
Agricultural Water Use Monitoring Report BACKGROUND
Who's the Chair and the Board? Land purchase and toll roads @ SRWMD
13 October 2020
smaller
PDF