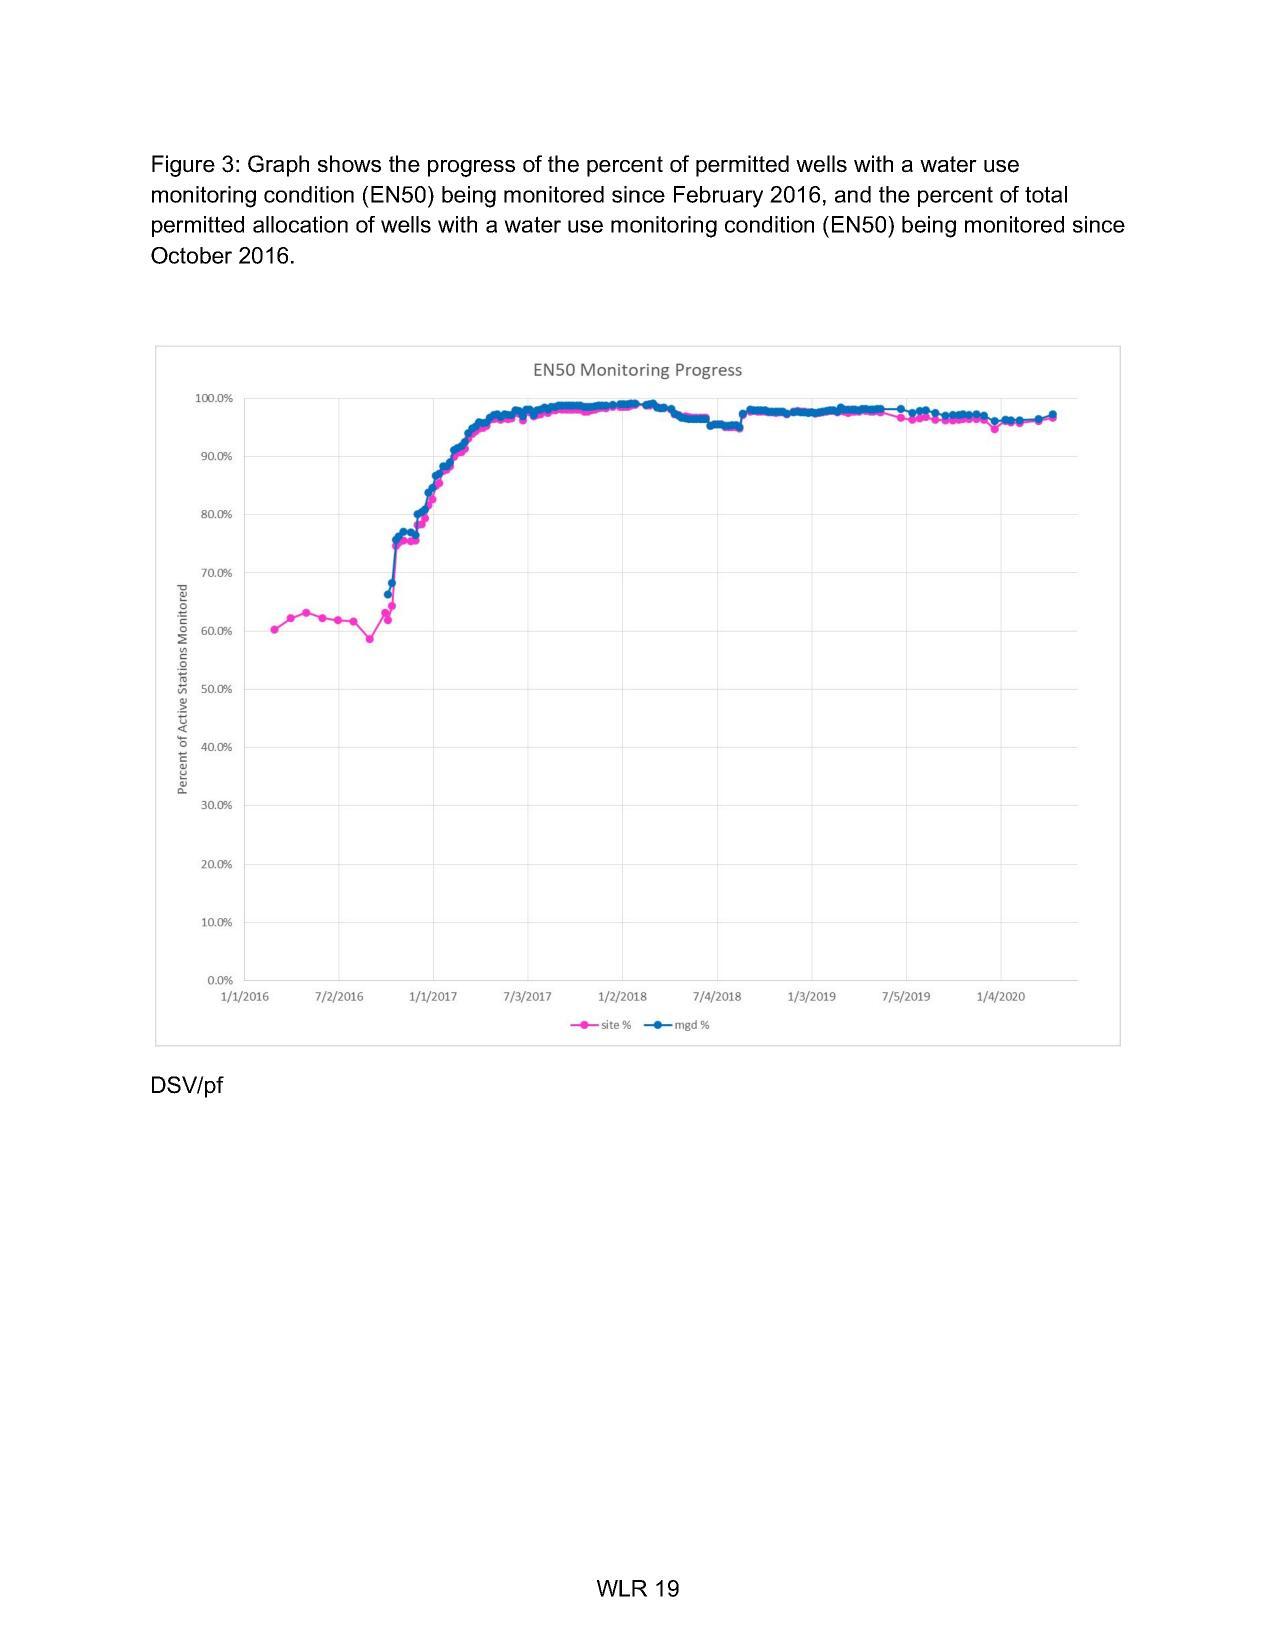
Figure 3: Graph shows the progress of the percent of permitted wells with a water use
Agricultural Water Use Monitoring Report BACKGROUND
Who's the Chair and the Board? Land purchase and toll roads @ SRWMD
13 October 2020
smaller
PDF