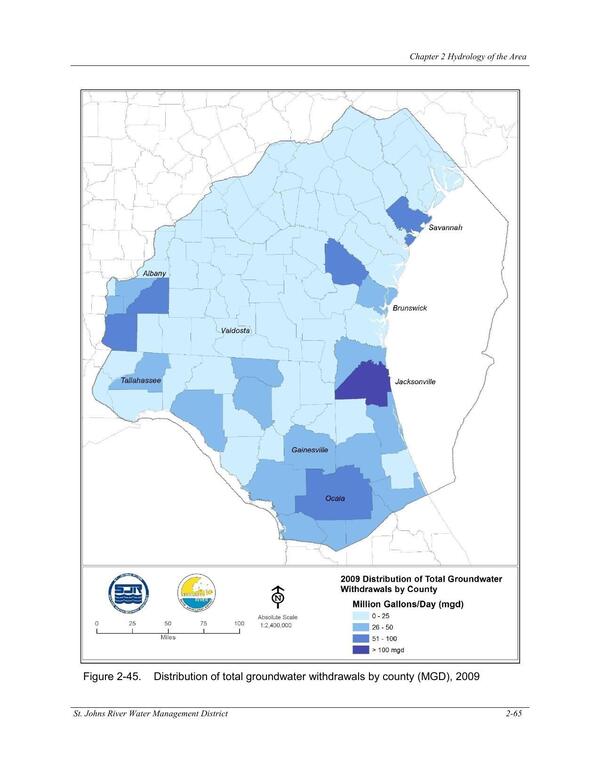
Figure 2-45. Distribution of total groundwater withdrawals by county (MGD), 2009
Pages
FIgures and Tables from NORTH FLORIDA SOUTHEAST GEORGIA GROUNDWATER MODEL (NFSEG V1.1)
1 August 2019
bigger
PDF