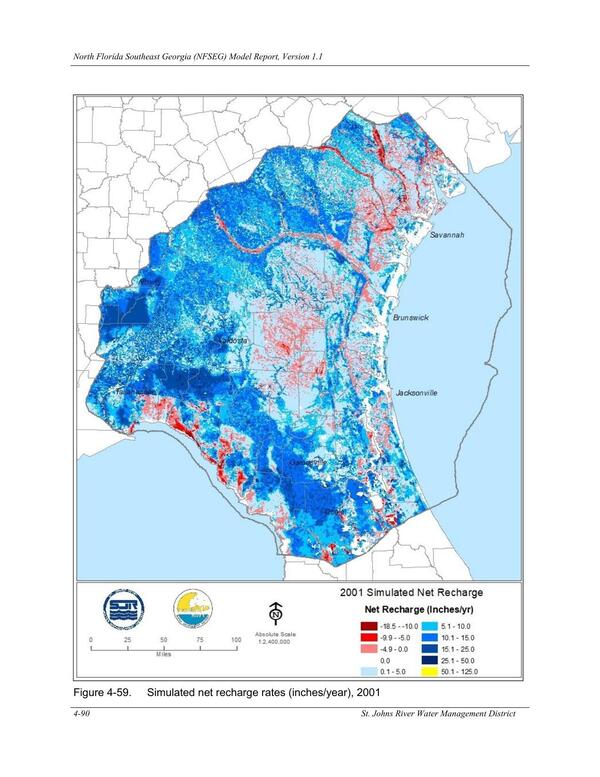
Figure 4-59. Simulated net recharge rates (inches/year), 2001
Pages
FIgures and Tables from NORTH FLORIDA SOUTHEAST GEORGIA GROUNDWATER MODEL (NFSEG V1.1)
1 August 2019
bigger
PDF