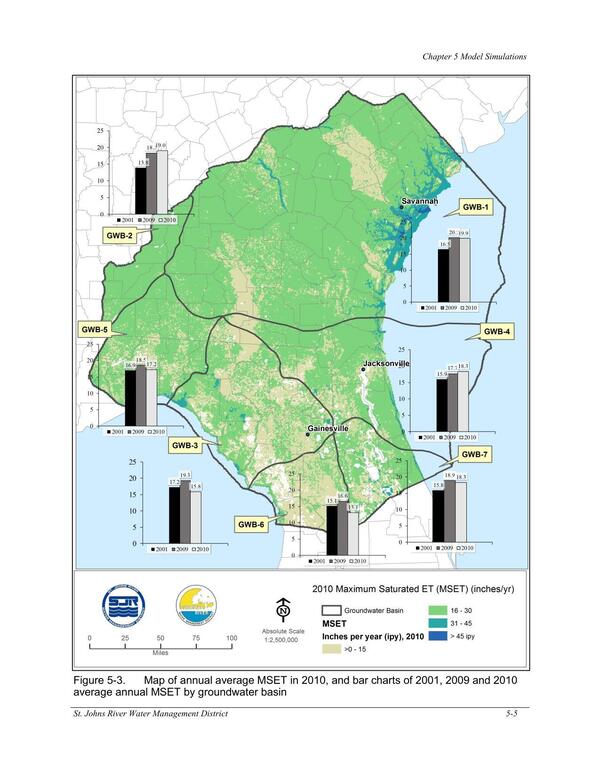
Figure 5-3. Map of annual average MSET in 2010, and bar charts of 2001, 2009 and 2010
Pages
FIgures and Tables from NORTH FLORIDA SOUTHEAST GEORGIA GROUNDWATER MODEL (NFSEG V1.1)
1 August 2019
bigger
PDF