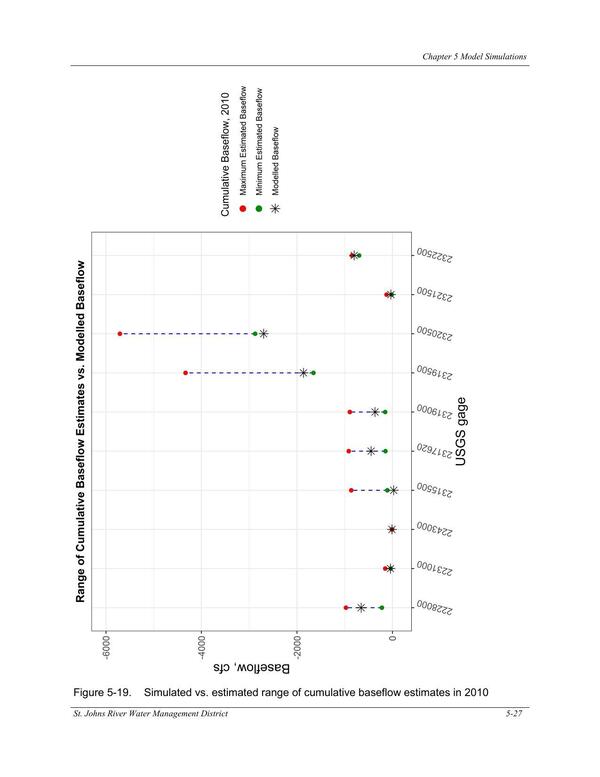
Figure 5-19. Simulated vs. estimated range of cumulative baseflow estimates in 2010
Pages
FIgures and Tables from NORTH FLORIDA SOUTHEAST GEORGIA GROUNDWATER MODEL (NFSEG V1.1)
1 August 2019
bigger
PDF