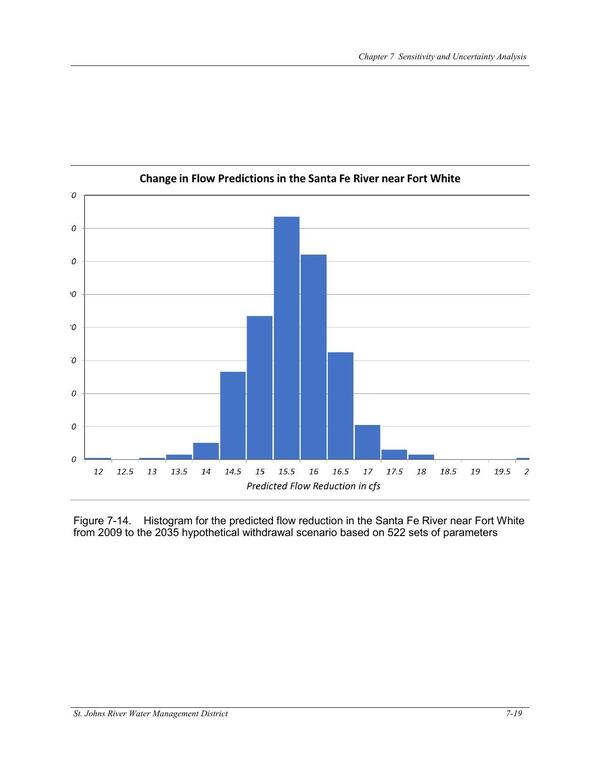
Figure 7-14. Histogram for the predicted flow reduction in the Santa Fe River near Fort White
Pages
FIgures and Tables from NORTH FLORIDA SOUTHEAST GEORGIA GROUNDWATER MODEL (NFSEG V1.1)
1 August 2019
bigger
PDF