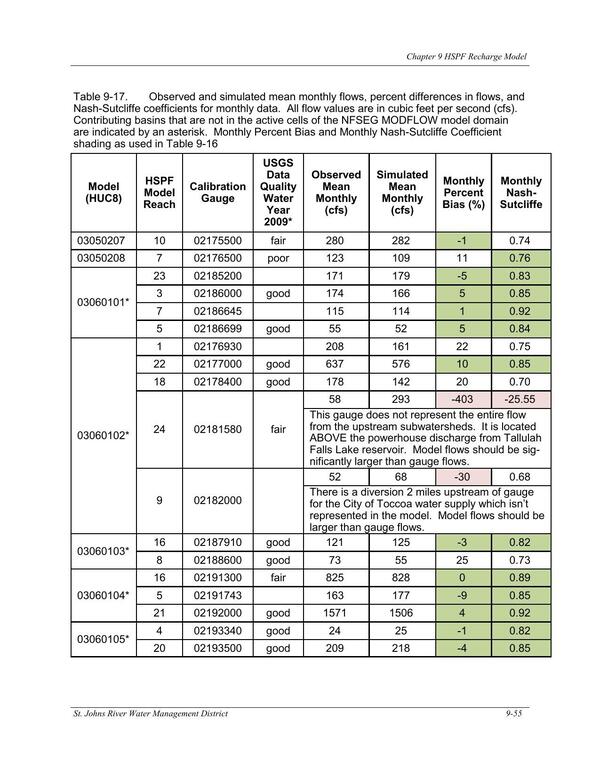
Table 9-17. Observed and simulated mean monthly flows, percent differences in flows, and Nash-Sutcliffe coefficients for monthly data. All flow values are in cubic feet per second (cfs).Pages | | FIgures and Tables from NORTH FLORIDA SOUTHEAST GEORGIA GROUNDWATER MODEL (NFSEG V1.1) | | 1 August 2019 | |
|