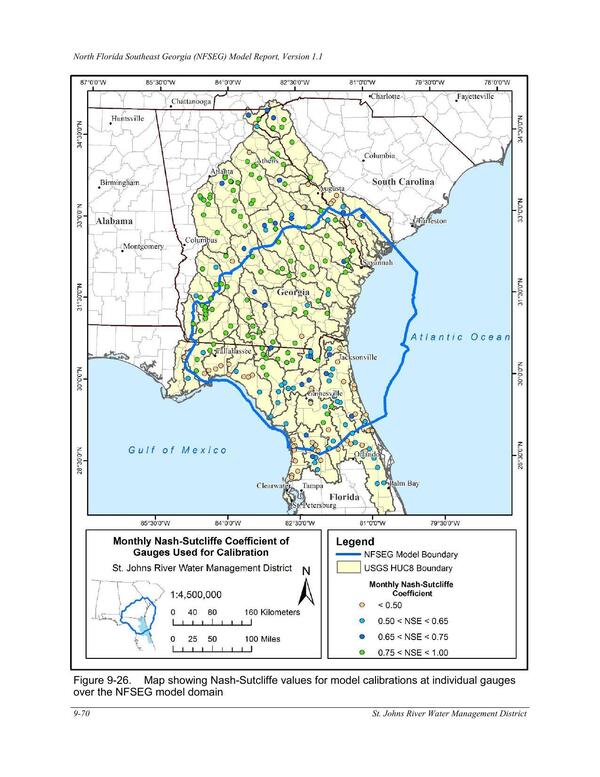
Figure 9-26. Map showing Nash-Sutcliffe values for model calibrations at individual gauges
Pages
FIgures and Tables from NORTH FLORIDA SOUTHEAST GEORGIA GROUNDWATER MODEL (NFSEG V1.1)
1 August 2019
bigger
PDF