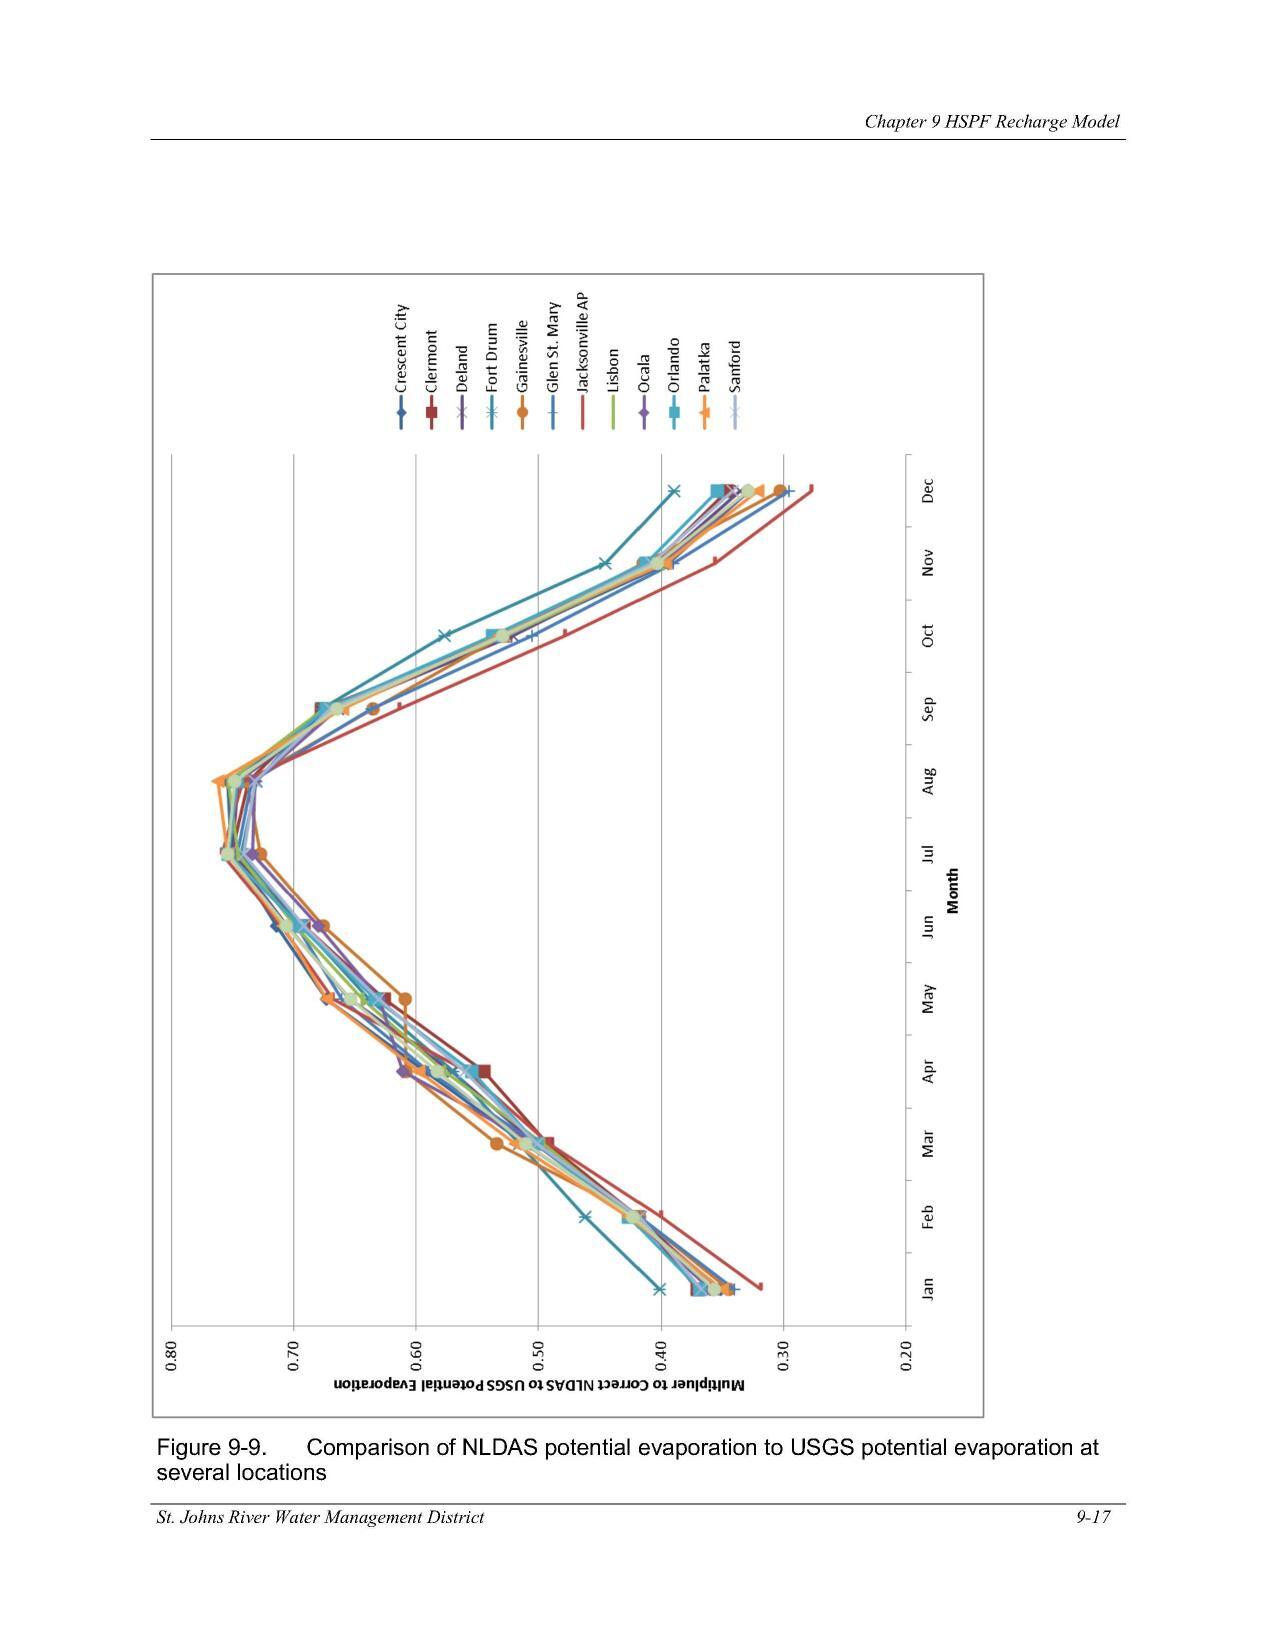
Figure 9-9. Comparison of NLDAS potential evaporation to USGS potential evaporation at
Pages
FIgures and Tables from NORTH FLORIDA SOUTHEAST GEORGIA GROUNDWATER MODEL (NFSEG V1.1)
1 August 2019
smaller
PDF