
 Plus early March rains really were directly on Valdosta,
even more than in Valdosta’s third wastewater spill of February,
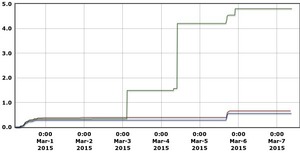
yet river levels rose most downstream.
Plus early March rains really were directly on Valdosta,
even more than in Valdosta’s third wastewater spill of February,
yet river levels rose most downstream.
Here are 90-day graphs of precipitation (in inches) and river levels (in feet) at the three Georgia Withlacoochee River gauges, from USGS. Also note river levels can continue dropping even while some new rain falls. Continue reading