
 An interesting flyer pointed out by Emily Davenport,
Storm Water Utilities Director, City of Valdosta.
It has many useful
contacts on the front,
and
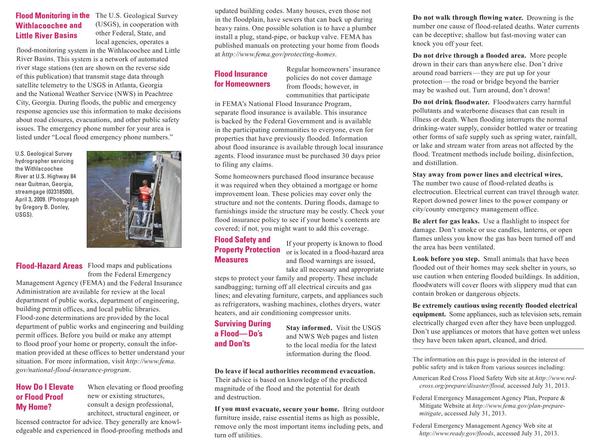
tips on the back (don’t walk or drive through flood waters)
but the most useful part is
inside,
where the flood-tracking chart is, in
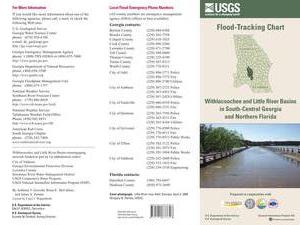
Flood-tracking chart for the Withlacoochee and Little River Basins in south-central Georgia and northern Florida,
2014, by Gotvald, Anthony J.; McCallum, Brian E.; Painter, Jaime A.,
USGS General Information Product: 155.
An interesting flyer pointed out by Emily Davenport,
Storm Water Utilities Director, City of Valdosta.
It has many useful
contacts on the front,
and
tips on the back (don’t walk or drive through flood waters)
but the most useful part is
inside,
where the flood-tracking chart is, in
Flood-tracking chart for the Withlacoochee and Little River Basins in south-central Georgia and northern Florida,
2014, by Gotvald, Anthony J.; McCallum, Brian E.; Painter, Jaime A.,
USGS General Information Product: 155.
Here are the gages mentioned in the chart, with links to the live USGS FloodTracking pages, listed here upstream to downstream:
-
 Little River at Upper Ty Ty Road, near Tifton GA
(02317797)
Little River at Upper Ty Ty Road, near Tifton GA
(02317797)
- Little River near Adel GA (02318000)
- Little River at GA 122, near Hahira GA (02318380)
-
 Okapilco Creek at GA 333, near Quitman GA
(02318700)
Okapilco Creek at GA 333, near Quitman GA
(02318700)
- Withlacoochee River at McMillan Road, near Bemiss, GA (023177483)
- Withlacoochee River at US 41 near Valdosta GA (02317755)
- Withlacoochee River at US 84, near Quitman GA (02318500)
- Withlacoochee River near Pinetta FL (02319000)
- Withlacoochee River near Madison FL (02319300)
- Withlacoochee River near Lee FL (02319394)
Here’s the text above the chart inside:
Flood-Tracking Chart for the Withlacoochee and Little River Basins in South-Central Georgia and Northern Florida
This Withlacoochee and Little River Basins floodtracking chart can be used by local citizens and emergency response personnel to record the latest river stage and predicted flood-crest information along the Withlacoochee River, Little River, and Okapilco Creek in south-central Georgia and northern Florida. By comparing the current stage (water-surface level above a datum) and predicted flood crest to the recorded peak stages of previous floods, emergency response personnel and residents can make informed decisions concerning the threat to life and property.
This chart shows a map of the basin with the location of selected real-time river stage stations, which are listed by name and station number. For each site, colored bars represent the five highest recorded peak stages and the years in which they occurred. The white bar provides a scale to record the most recently reported river stage from the U.S. Geological Survey (USGS). The USGS Georgia Water Science Center displays available real-time river stage data on the Web at http://water.usgs.gov/ga/nwis/rt.
For each of the selected stations that is a flood forecast point, the predicted flood-crest information from the National Weather Service (NWS) can be recorded. USGS data are used by the NWS for its flood-forecasting models. The NWS routinely broadcasts this forecast information to the media and on National Oceanic and Atmospheric Administration (NOAA) Weather Radio (NWR). Current NWR broadcast frequencies can be accessed at http://www.nws.noaa.gov/nwr/nwrbro.htm.


-jsq
Short Link:
Pingback: Flooding study presentations by Army Corps in Valdosta 6 May 2014 | WWALS Watershed Coalition
Pingback: Flooding charts | WWALS Watershed Coalition