
The rainiest season in south Georgia and north Florida is the summer, yet that’s when rivers are usually the lowest. Here are seven years of data from the USGS Withlacoochee River Gauge at US 41 (North Valdosta Road) in Valdosta, Georgia. Rain is pretty steady through the year (except when there’s no rain), yet the river level varies wildly, highest in the winter, usually. Unless there are hurricanes in the fall, as happened in 2017 and 2016.
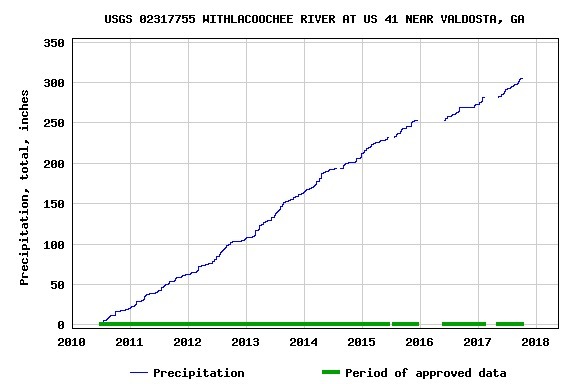
Rain Years 2010-2018
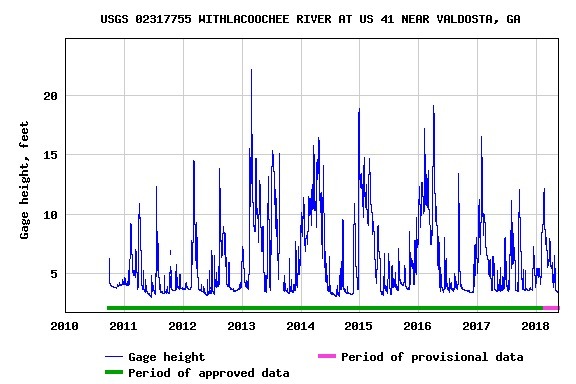
Level Years 2010-2018
Why does this happen? Evapotranspiration.
![]()
Evapotranspiration is the sum of evaporation from the land surface plus transpiration from plants. Precipitation is the source of all water.
Credit: Salinity Management Guide, found in USGS
Evapotranspiration – The Water Cycle.
That definition doesn’t count evaporation directly from exposed water surfaces such as lakes, ponds, and rivers, but of course that happens, too. The rain falls, but the water goes right back up. Unless enough rain falls that it can’t evaporate or transpire as rapidly. Or it falls where it runs off quickly because of clearcutting and paving, as happened in 2013 and 2009.
Years
It may be easier to see this effect year by year.
2018
We’re less than half-way through 2018, but we can already see the rains and river rises started late, in late January and February. The graphs for this year make it look like river levels always rise right after local rains. Yet mid-March shows that ain’t necessarily so: rain fell, but the river rose slowly until a week later, presumably due to rains farther upstream. Previous years show even more decoupling of rain and levels.

2018, Rain

2018, Level
2017
Last year we had a wet winter, but even after the rain stopped in March, it took a couple of months for the river to drop, because it was still cool enough for not a lot of evapotranspiration. Plus there was probably rain upstream. Eventually the river rose in late August and early September with Hurricanes Harvey and Irma. We were warned of 100 mile an hour winds from Irma, which fortunately we did not get, but we did get quite a bit of rain. The river rose even more in October, presumably because of rain side-effects of Hurricanes Nate and Ophelia. Again in December the river rose, as it usually does, even though there was no local rain.

2017, Rain

2017, Level

Seasonal Summary, in 2017 Atlantic hurricane season, Wikipedia.
2016
There must have been rain upstream in winter 2016. But even when rain started at this gauge in June, the river did not rise much, except for a big blip in September, which I believe was Hurricane Hermine. Hermine, then a tropical storm, passed directly over my house.

2016, Rain

2016, Level

Seasonal Summary, in 2016 Atlantic hurricane season, Wikipedia.
2015
2015 was close to a “normal” year. Rain fell most of the year, and the river was high through April, again in May, and again in November and December. That was a light hurricane season, and there were no big rises in the fall.

2015, Rain

2015, Level

Seasonal Summary, in 2015 Atlantic hurricane season, Wikipedia.
2014
The river was high well into June 2014, which is unusual. Not much in the way of hurricanes that year, and not much river rise in the fall, except a blip in October, which may or may not have been related to Hurricane Gonzalo.

2014, Rain

2014, Level

Seasonal Summary, in 2014 Atlantic hurricane season, Wikipedia.
2013
The second 700-year flood year, four years after 2009, started with both rain and river low in January and February, then shooting up in March through May, and again in June through August. Can’t really blame this on hurricanes, since there weren’t any big ones, and none of them came here.

2013, Rain

2013, Level

Seasonal Summary, in 2013 Atlantic hurricane season, Wikipedia.
2012
Winter rain and levels got shifted into February, March, and April, 2012, with more river rises in August and September. We did get some tropical storms coming through here, but the August 2012 flooding seems more likely to have been due to clearcutting and impervious surfaces.

2012, Rain

2012, Level

Atlantic Hurricane Season Summary Map, in 2012 Atlantic hurricane season, Wikipedia.

Seasonal Summary, in 2012 Atlantic hurricane season, Wikipedia.
2011
May and August were unusual high-water months, with low winters beginning and ending 2011. Maybe August was related to some of the tropical storms; I don’t remember.

2011, Rain

2011, Level

Seasonal Summary, in 2011 Atlantic hurricane season, Wikipedia.
2010
Can’t say a lot about 2010, because approved data only started in November. However, you can see high rain in late October and high water early November. That fall rain might have been related to Tropical Storm Tomas, or maybe not. The river then rose as usual in December.

2010, Rain

2010, Level

Seasonal Summary, in 2010 Atlantic hurricane season, Wikipedia.
2009
There’s no data for the Valdosta Gauge before 2010, because Valdosta only started paying for that gauge that year, after the infamous 700-year flood of April 2009, just like Lowndes County started paying for the Little River Hahira Gauge on GA 122 at Folsom Bridge.
Other gauges upstream and down have data going back farther, but this is enough for one blog post.
And remember, Valdosta hasn’t had a significant sewage spill in a year and a half, because after the 2009 and 2013 floods, Valdosta and Lowndes County spent tens of millions of dollars upgrading infrastructure, including a new Withlacoochee Wastewater Treatment Plant uphill out of the flood plain, a new force main, and many other sanitary sewer system improvements. The big spills during Irma in 2017 were from Tifton and Quitman. Which is one reason we’re working up a water quality monitoring program.
-jsq, John S. Quarterman, Suwannee RIVERKEEPER®
You can join this fun and work by becoming a WWALS member today!
Short Link: