Tag Archives: contamination

Monthly Valdosta WQ Data 2019-02-07

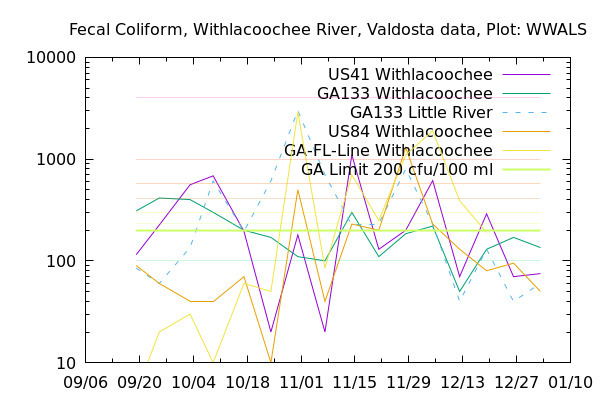
Valdosta has fallen down to only monthly water quality testing, instead of their former weekly schedule.

Graph, Withlacoochee River Basin, Withlacoochee

They’ve also dropped their two state line stations, so the GA-FL Line trace on this graph ends in December 2018.

Wide Map, Stations

Readings have risen since their January sampling, with Valdosta’s US 84 sampling station above the Georgia state limit at 265 cfu/100 ml of E. coli. Continue reading

Still below the limit: fecal coliform in Valdosta river data 2019-01-02

Three weeks in a row! The Valdosta river water quality testing data WWALS obtains through a weekly open records request shows all stations tested below the Georgia state limit last Wednesday.

Graph, Withlacoochee River Basin, Withlacoochee

However, like the week before, there are no data for Continue reading

Good news and puzzling new in Valdosta water quality data 2018-12-26

There’s good news in response to the weekly open records request from WWALS to Valdosta: all stations reporting are well within the Georgia state limit for bacterial levels. There’s also some puzzling news.

Graph, Withlacoochee

The puzzling news is that Continue reading

Almost all below the limit 2018-12-19

The irony: Valdosta’s warning sign is still up at Troupville Boat Ramp after its six spills weekend before last, yet Valdosta’s own weekly water quality testing stations almost all measured below the state limits for Fecal coliform and E. coli.

Graph, Withlacoochee

The exception was at Continue reading

Bacteria levels all dropped 2018-12-12

Bacterial levels at all stations Valdosta tests dropped this week, according to the Wednesday 12 Dec 2018 test results returned for a WWALS open records request.

Graph, Withlacoochee

The only station above the 200 cfu/100 ml Fecal coliform limit was at Continue reading

Over the Fecal coliform line at the state line, Withlacoochee River 2018-12-05

Another mysterious rise of bacterial counts at Horn Bridge, at Mozell Spells, near State Line Ramp, Withlacoochee River, in the latest data from Valdosta, from Wednesday, December 5, 2018, obtained as usual through open records request.

Graph, Withlacoochee

Continue reading

Bacterial levels rising again 2018-11-28

The Alapahoochee River at the GA-FL line measured ten times the EPA limit on Fecal coliform again this Wednesday, November 28, 2018.

GA 135 Alapahaoochee River, Alapaha

It does not seem to be coming downriver from Valdosta. Continue reading

Much better readings in Valdosta water quality data 2018-11-21

Suddenly, all the fecal coliform readings are down. Was there a first flush from the rain on November 14 that caused the high readings of that day, and all that washed down the rivers within a week?

Graph, Withlacoochee Basin

At US 41 (North Valdosta Road), the Withlacoochee River was actually in minor flood several of the intervening days, according to the USGS US 41 (Valdosta) Gauge. Continue reading

What happened on the Alapahoochee River? 2018-11-14

Twenty five times the state limit for Fecal coliform could be a problem. What got into the Alapahoochee River last week?

Graph, Alapaha Basin

GA 135, Alapahoochee River, Alapaha Basin

If you want to help find out what’s getting into our rivers, you can Continue reading

First flush 2018-10-31

Was there rain Wednesday? That might explain the sudden spikes at US 41 on the Withlacoochee River, at GA 133 on the Little River, and at State Line on the Withlacoochee River. We can guess that the rains Thursday and Friday (today) have washed away whatever that very odd spike was at the state line.

Graph, Withlacoochee Basin

Thanks to Valdosta Utilities and Valdosta City Clerk Teresa Bolden for sending this Wednesday’s Valdosta water quality testing data before the end of Friday. For more contact, see https://wwals.net/issues/vww/.

State Line, Withlacoochee River, Withlacoochee Basin

It’s a very odd spike, because Continue reading