
 Plus early March rains really were directly on Valdosta,
even more than in Valdosta’s third wastewater spill of February,
yet river levels rose most downstream.
Plus early March rains really were directly on Valdosta,
even more than in Valdosta’s third wastewater spill of February,
yet river levels rose most downstream.
Here are 90-day graphs of precipitation (in inches) and river levels (in feet) at the three Georgia Withlacoochee River gauges, from USGS. Also note river levels can continue dropping even while some new rain falls.


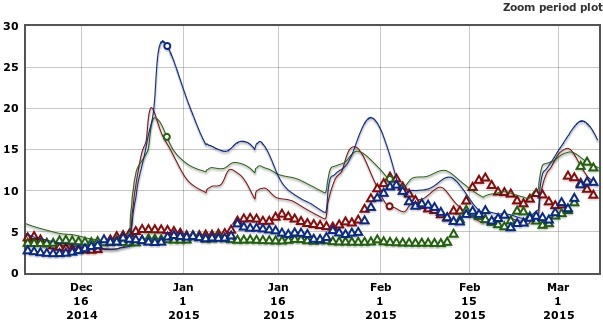
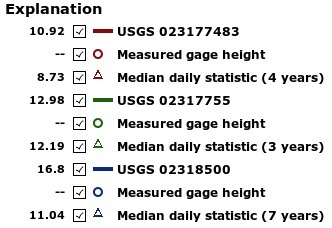
The Florida gauges are shown separately because they use a different base level. Precipitation doesn’t seem to be available for the Florida gauges. See also always-current levels for all the gauges.


Rain falls in spurts for a day or two, while the river keeps rising for a while, and then falls for days.
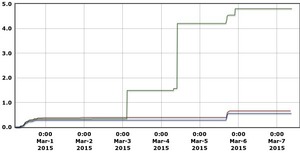
Perhaps even more interesting are these 7-day graphs, which show much more rain falling at US 41 on Valdosta (the tall green line) than upstream or downstream, yet the river rose the most downstream. As you can see by the 90-day graph, this early March rainfall was even more disproportionately on Valdosta than on “Feb. 25-26, 2015, a severe weather system dumped over three inches of rain on the City of Valdosta and the surrounding areas, most of which arrived overnight between 7 p.m. and 7 a.m.” when Valdosta reported its third big wastewater spill of the month.


These Valdosta rains also appear to have affected
Alapaha River water levels; not surprisingly, since
half of Valdosta is in the Alapaha River watershed.
Fortunately, this time Valdosta doesn’t seem to have had any wastewater spills to report.
-jsq
Short Link:
Pingback: Videos: Valdosta Wastewater meeting with slides 2015-03-17 - WWALS Watershed Coalition