
Update 2017-05-18: Salt water intrusion inland is worse than you think, including the “Apalachicola salinity feature” up to the GA-FL line and east through Lowndes County, with a special additional brackish Valdosta feature. See Revised Hydrogeologic Framework of the Floridan Aquifer System 2016-03.
Update 2016-02-22: Fixed URLs for DEP files.
Salt water and other solids are coming up in Florida wells far inland from the sea,
 right up to the state line, and it probably doesn’t stop there.
The problem is worse on the coasts and in south Florida, but
north central Florida is not immune, judging by these
preliminary maps by the Florida Department of Environmental Protection.
Likely culprits would seem to include overpumping.
right up to the state line, and it probably doesn’t stop there.
The problem is worse on the coasts and in south Florida, but
north central Florida is not immune, judging by these
preliminary maps by the Florida Department of Environmental Protection.
Likely culprits would seem to include overpumping.
WWALS requested permission to post these maps 10 July 2015, and it was granted 3 September 2015 by Rick Copeland, P.G. Ph.D., Environmental Consultant, Florida Department of Environmental Protection (FL-DEP), to use MAPS-Read_Me_First.pdf as the official summary. The text of that file is quoted below; all other remarks are not by FL-DEP. The example maps in this post are for statewide preliminary results; other blog posts will include more specific maps.
Salinity Network Workgroup
Preliminary Maps for Developing a Coastal Salinity Monitoring NetworkBackground: Over the past several decades, Florida has observed degradation in
its groundwater resources. For example, Williams et al. (2011) observed long-term groundwater-level declines in the Floridan Aquifer System (FAS). Copeland et al. (2011) observed decreases in spring flow, along with increases in the concentrations of salts, such as sodium and chloride in groundwater across the state. For these reasons, in 2011, the Florida Water Resources Monitoring Council established the Salinity Network Workgroup (SNW) to address the growing concern. The SNW is made up of over 20 monitoring organizations in Florida involved in the monitoring of Florida’s groundwater. One of the priorities of the SNW is to develop a statewide Coastal Salinity Monitoring Network (CSMN).
Development of the Coastal Salinity Monitoring Network: The SNW meets several time per year. For the May 13, 2015 meeting, the Florida Department of Environmental Protection (DEP) was asked by the SNW membership to construct preliminary maps that could be used to delineate areas where monitoring sites for the CSMN could be located (http://publicfiles.dep.state.fl.us/dear/FWRMC/). The maps are based on 15 years (2000-2014) of water samples collected from randomly selected wells which are part of the statewide DEP Status Monitoring Network (https://www.dep.state.fl.us/water/monitoring/). Each sampling location represents the results of one sampling event. If a well was sampled more than one time, the most recent sample was used.
The maps are separated by WMD. Within each WMD, you can find maps for chloride (Cl), specific conductance (SC), sulfate (SO4), total dissolved solids (TDS), and calculated total dissolved solids (CTDS). TDS is sometimes referred to as residuals and represent an estimate of all solids in a groundwater sample. As presented in the maps, CTDS represents the sum total of calcium, magnesium, sodium, potassium, alkalinity, Cl, and SO4 (the seven most abundant cations and anions in terms of mass).
On many of the maps contours were modeled using inverse distance
weighting. All available data were used in model creation, and the models have not yet been validated using independent data. In a few situations, contour intervals were based on arbitrary intervals. However for most maps contours are based on percentiles of concentration values. Agresti and Franklin (2009) defined a percentile to be a value such that x percent of the observations fall below or equal to that value. Suppose a well has 114 measurements for Cl over a span of 20 years. Suppose that in May of 2010 the concentration of Cl was 158 mg/L and that the corresponding percentile was 75. This means that 75% of all observations were less than or equal to 158 mg/L, while 14% were greater than that value. For most maps the contour intervals were based on the 50th, 75th, and 90th percentiles. Percentiles are based on two sets of data: (1) all historical data restricted to the corresponding water management districts (WMDs), and (2) all historical data from all five WMDs (statewide).
The aquifer and aquifer systems identified on the maps are: the
Floridan aquifer system (FAS), the intermediate aquifer system (IAS), and surficial aquifer system (SAS), along with a subdivision in northwest Florida, the sand-andgravel aquifer (SGA). In northwest Florida and in south Florida, the FAS dips downward in the geologic section. Because of this the concentration of saline analytes increase in these areas. The increases are natural. For water use, wells in these areas are completed into shallower aquifer systems, such as the SAS.
References Cited
Agresti A, and Franklin, C, 2009, Statistics: the art and science of learning from data, 2nd ed.: Upper Saddle River, NJ, Pearson/Prentice Hall, 767 p.
Copeland RE, Doran NA, White AJ, Upchurch SB, 2011, Regional and statewide trends in Florida’s spring and well groundwater quality (1991-2003) (revised). Florida Geological Survey Bulletin 69.
Williams LJ, Dausman AD, and Bellino JC, 2011, Relation of aquifer confinement and long-term groundwater-level declines in the Floridan aquifer system. Proceedings of the 2011 Georgia Water Resources Conference, April 11-13, 2011. University of Georgia, Athens.
-jsq
Chloride in Status Network Wells (All Aquifers)
Chloride in Status Network Wells (All Aquifers) Modeled Using Inverse Distance Weighting
Specific Conductance in Status Network Wells (All Aquifers)
Specific Conductance in Status Network Wells (All Aquifers) Modeled Using Inverse Distance Weighting

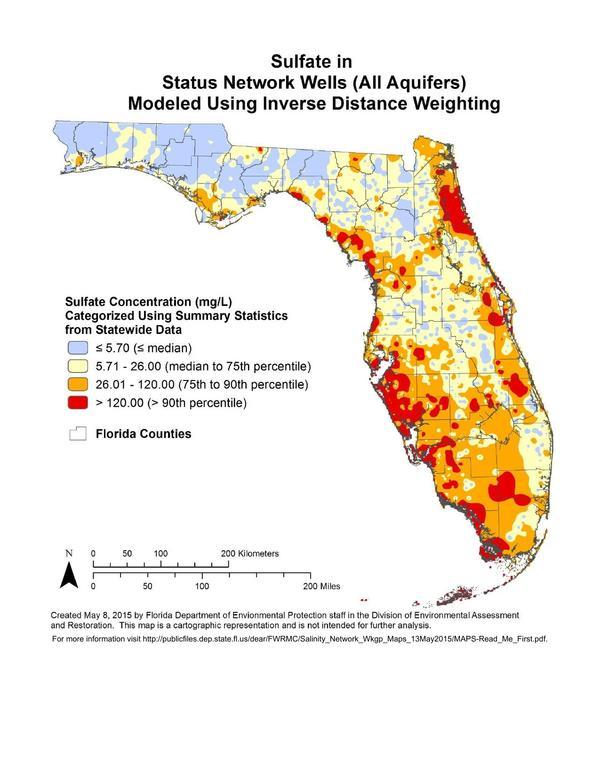
Sulfate in Status Network Wells (All Aquifers)

Sulfate in Status Network Wells (All Aquifers) Modeled Using Inverse Distance Weighting
Total Dissolved Solids (TDS) in Status Network Wells (All Aquifers)

Total Dissolved Solids (TDS) in Status Network Wells (All Aquifers) Modeled Using Inverse Distance Weighting

Calculated Total Dissolved Solids (TDS) in Status Network Wells (All Aquifers)

Calculated Total Dissolved Solids (TDS) in Status Network Wells (All Aquifers) Modeledjsing Inverse Distance Weighting

Chloride in Status Network Intermediate Aquifer System Wells

Specific Conductance in Status Network Intermediate Aquifer System Wells

Sulfate in Status Network Intermediate Aquifer System Wells

Total Dissolved Solids (TDS) in Status Network Intermediate Aquifer System Wells

Calculated Total Dissolved Solids (TDS) in Status Network Intermediate Aquifer System Wells

Status Network Surficial Aquifer System (SAS) Status Network Well Locations

Chloride in Status Network Surficial Aquifer System Wells

Chloride in Status Network Surficial Aquifer System Wells Modeled Using Inverse Distance Weighting

Specific Conductance in Status Network Surficial Aquifer System Wells

Specific Conductance in Status Network Surficial Aquifer System Wells Modeled Using Inverse Distance Weighting

Sulfate in Status Network Surficial Aquifer System Wells

Sulfate in Status Network Surficial Aquifer System Wells Modeled Using Inverse Distance Weighting

Total Dissolved Solids (TDS) in Status Network Surficial Aquifer System Wells

Total Dissolved Solids (TDS) in Status Network Surficial Aquifer System Wells Modeled Using Inverse Distance Weighting

Calculated Total Dissolved Solids (TDS) in Status Network Surficial Aquifer System Wells

Calculated Total Dissolved Solids (TDS) in Status Network Surficial Aquifer System Wells Modeled Using Inverse Distance Weighting

Chloride in Status Network Upper Floridan Aquifer Wells

Chloride in Status Network Upper Floridan Aquifer Wells Modeled Using Inverse Distance Weighting

Specific Conductance in Status Network Upper Floridan Aquifer Wells

Specific Conductance in Status Network Upper Floridan Aquifer Wells Modeled Using Inverse Distance Weighting

Sulfate in Status Network Upper Floridan Aquifer Wells

Sulfate in Status Network Upper Floridan Aquifer Wells Modeled Using Inverse Distance Weighting

Total Dissolved Solids (TDS) in Status Network Upper Floridan Aquifer Wells

Total Dissolved Solids (TDS) in Status Network Upper Floridan Aquifer Wells Modeled Using Inverse Distance Weighting

Calculated Total Dissolved Solids (TDS) in Status Network Upper Floridan Aquifer Wells

Calculated Total Dissolved Solids (TDS) in Status Network Upper Floridan Aquifer Wells Modeled Using Inverse Distance Weighting

Short Link:
Pingback: Florida Well Salinity Study | WWALS Watershed Coalition | J.W. McFarlane's