Tag Archives: Teresa Bolden

Valdosta sewage spill reports to GA-EPD from November 7 through December 3, 2024

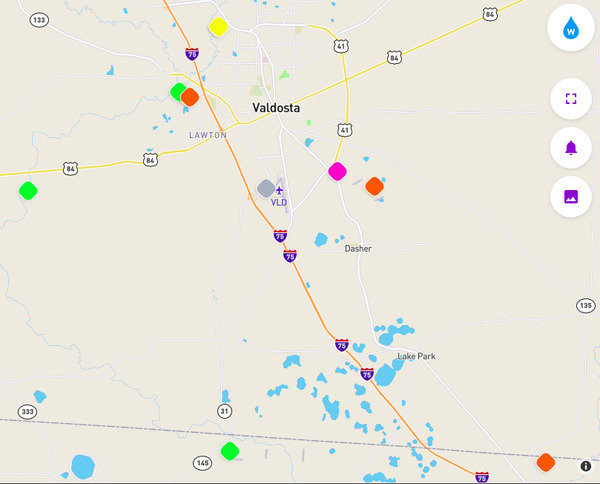
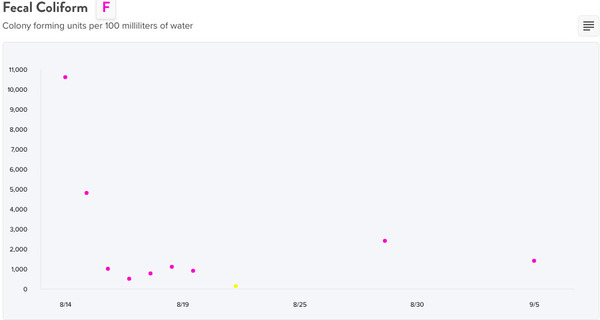
Update 2024-12-13: Filthy Sugar Creek, dirty Franks Creek, bad upstream Withlacoochee River, clean downstream 2024-12-12.

I got part of what I asked for in an open records request to the City of Valdosta: “All sewage spill reports sent to the Georgia Environmental Protection Division (GA-EPD) on or after November 6, 2024, through December 2, 2024”. Those provide some extra detail, and some hints of fixes being planed for these problems.

[Valdosta sewage spill reports to GA-EPD, from November 7 through December 3, 2024]
Valdosta sewage spill reports to GA-EPD, from November 7 through December 3, 2024

I did not get the rest of it: “together with all associated correspondence between the City of Valdosta, GA-EPD, and other parties including state agencies in Georgia and Florida and relevant landowners.”

The December Meadowbrook Drive spill into Two Mile Branch

Let’s look at the most recent spill in the GA-EPD Sewage Spills Report, and compare that to what Valdosta Utilities sent to GA-EPD. Continue reading

Dirty Crooked Creek Wednesday & Friday; Withlacoochee River better in GA Wednesday 2020-02-21

Update 2020-02-28: Madison County fed up with contaminated water –WCTV 2020-02-26

Two of these rows are not like the first, and the middle ones are worst.

[Three sets]
Three sets

The really ugly plates in the middle were made from water collected at the Devane Road bridge over Crooked Creek, just off of US 84, in Brooks County, Georgia, a bit east of Okapilco Creek, upstream of Knights Ferry Boat Ramp on the Withlacoochee River.

[Crooked Creek Bridge]
Crooked Creek Bridge

You can see these Friday results are even worse than what the Coles saw Wednesday. In this table of results for this week, focusing on Brooks County and downstream, my Friday Devane Road result is up in the range of what Valdosta saw for Monday at Knights Ferry on the Withlacoochee River. My Monday result for Devane Road was actually taken at US 84, and it would appear I was sampling ditch water, not the main creek. We will be using the Devane Road bridge location for sampling Crooked Creek. And if anyone knows a better name for this creek, let us know.

[Crooked Creek quite bad]
Crooked Creek quite bad
The entire WWALS composite spreadsheet of data from three Florida agencies, WWALS, and Valdosta is on the WWALS website.

I even stopped by Valdosta City Hall Friday to compliment them on something. But there is more Valdosta and the state of Florida need to do.

WWALS will keep testing. You can help.

The first row of plates is Continue reading

Signs in Georgia on Withlacoochee River and new data; thanks Lowndes County and SRWMD 2020-01-10

Update 2020-01-14: Recent water quality test results, Withlacoochee and Suwannee Rivers 2020-01-11

There are two warning signs at each of Knights Ferry, Nankin, and State Line Boat Ramps as of yesterday: by Lowndes County, and by WWALS. According to new data from Wednesday evening, those signs may not have been necessary, but at this point better safe than sorry. The new data did not come from Valdosta, nor did the signs.

[County and WWALS warning signs]
Photo: John S. Quarterman, County and WWALS warning signs at Knights Ferry Boat Ramp, 2020-01-10

Thanks to Lowndes County and Chairman Bill Slaughter for testing at Knights Ferry, Nankin, and State Line Boat Ramps, and for making and planting those tall metal caution signs after the county numbers for Monday, January 6, 2020, were quite high. The county is now doing weekly testing, including at additional locations.

Just in case, WWALS also made signs and placed them. Continue reading

Valdosta water quality testing data 2018-09-12

Here is most of a year’s river water quality testing data from the city of Valdosta, on a Water Reporter map:

Valdosta stations, Map

Click on any of the colored diamonds for graphs. Scroll right to see more graphs. Click on any graph to see every datapoint. Clearly fecal coliform (FCOLI) and E. coli (ECOLI) have significant spikes way beyond the Georgia state limit of 200 cfu/100 ml.

However, as we already saw on the spill followup data map, often, even usually, FCOLI and ECOLI are just as bad or worse upstream Continue reading

Followup water quality data after big Valdosta 2018 spills 2018-09-21

Here is (at least some of) the water quality testing data Valdosta was required to collect after its major spills of June in the Withlacoochee River basin and August in the Alapaha River basin. Maybe Valdosta is right that neither of these spills got into waterways, but something sure did, according to this data. Curiously, in both cases the worst fecal coliform readings were upstream from the spill location.

Mud Creek WTP after the 13 August 2018 spill

Below at Johnson Road, Mud Creek WTP
Downstream at Johnson Road on Mud Creek from the Mud Creek WTP after the August spill

There’s only one datapoint (the yellow dot) on that graph below the Georgia safe limit for fecal coliform of 200 colony forming units per 100 milliliters of water (cfu/100 ml). You’d think it would be better upstream, right? Continue reading