Here are some pictures from the last year, and we’ll be back today at the Berrien County Harvest Festival.
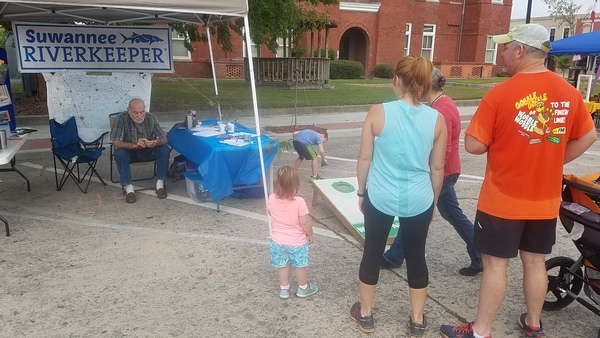

Here are some pictures from the last year, and we’ll be back today at the Berrien County Harvest Festival.
Here is most of a year’s river water quality testing data from the city of Valdosta, on a Water Reporter map:
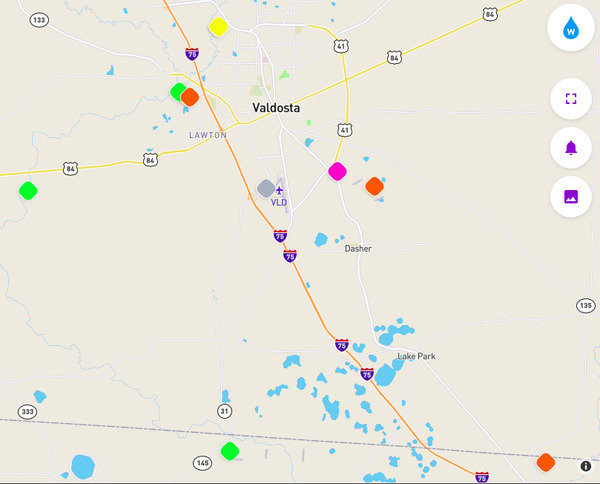
Click on any of the colored diamonds for graphs. Scroll right to see more graphs. Click on any graph to see every datapoint. Clearly fecal coliform (FCOLI) and E. coli (ECOLI) have significant spikes way beyond the Georgia state limit of 200 cfu/100 ml.
However, as we already saw on the spill followup data map, often, even usually, FCOLI and ECOLI are just as bad or worse upstream Continue reading
Pollution spill maps online, up to date, with interactive links to details: Florida is doing it, and so can Georgia.
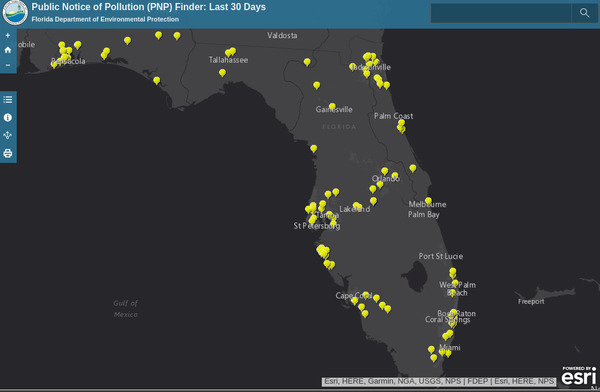
For more than a year FDEP has been posting spill reports online in a spreadsheet the same day it gets them, with email notice signup (Alabama also does that). FDEP has added a Public Notice of Pollution (PNP) Finder: Last 30 Days, which helps a lot in finding spills in our watersheds.
Did you know there was a Phosphoric Acid spill at White Springs last week, on Continue reading