Update 2021-01-06: Bad up and down: Withlacoochee River 2021-01-05.
Tifton spilled raw sewage three times over the weekend, all into the New River, upstream of the Withlacoochee River. As already reported, Valdosta spilled into Knights Creek, which goes into Mud Swamp Creek, the Alapahoochee River, and the Alapaha River just above Sasser Landing. We have no water quality data downstream of any of those spills.
Plus Quitman finally reported a spill from more than a week ago, but downstream water quality on the Withlacoochee River the next day was actually better than the day before.
However, the big rains in between drove plenty of contamination, probably mostly cow, pig, and horse manure, into the Withlacoochee, with even Madison Health showing too-high E. coli at State Line for December 29, 2020.
The even bigger rains this past Thursday, Friday, and Saturday probably have done the same.
So I’d recommend avoiding not just the Withlacoochee River, but also the Alapaha River for a few days, until better test results come in.
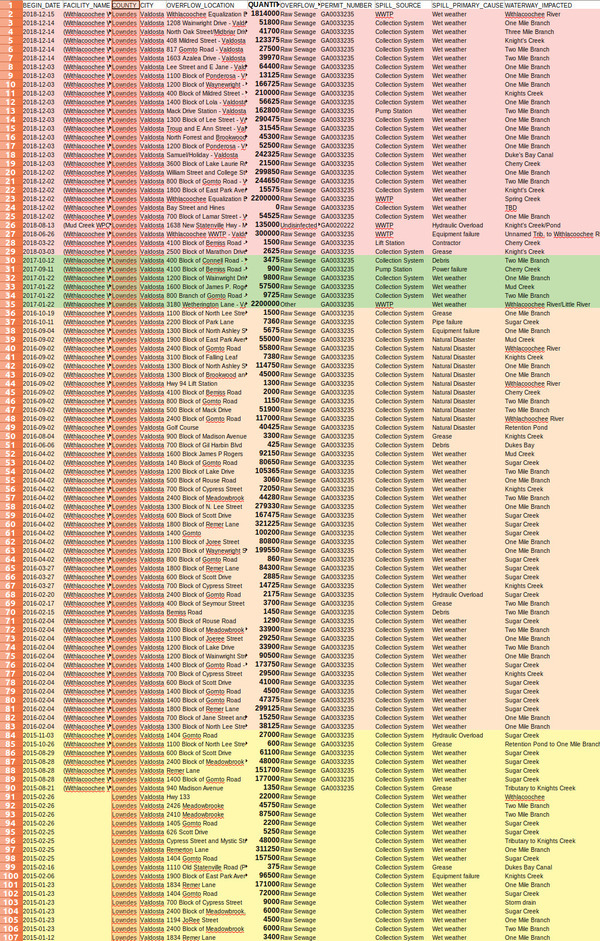
![[Spills and little data]](https://www.wwals.net/pictures/2021-01-03--wq/many.jpg)
The one recent datapoint we have is WWALS tester Tasha Ekman LaFace’s record-high for that location 1,333 cfu/100 mL E. coli at Naylor Park Beach on the Alapaha River, just upstream from US 84. But that can’t be from the Valdosta sewage spill, since Naylor Beach is way upstream of the Alapahoochee River Confluence with the Alapaha River. However, Naylor Beach is not a long way downstream from Lakeland, so it will be interesting if we hear about any spills from there. Continue reading
![[Sewage Spill, Mildred Street, Valdosta, Alapaha River]](https://www.wwals.net/pictures/2021-01-02--valdosta-mildred-street-dukes-bay-canal-spill/many.jpg)
![[Ground breaking]](https://www.wwals.net/pictures/2020-07-21--vld-catch-basin/IMG_6467.jpg)
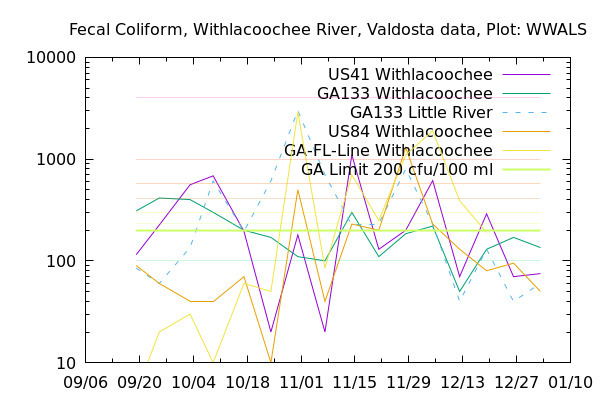
![[Fecal coliform Graph, Withlacoochee River Basin]](https://www.wwals.net/pictures/2019-05-07--vld-gora/withgraphfecal.jpg)