
Update 2025-09-21: Graphs from water.noaa.gov.
 Update 2016-12-23: graphs from water.weather.gov.
Update 2016-05-31: See sea level gage reports.
Update 2015-04-28: Added flood stages and tentative highest safe and lowest boatable water levels, both above the charts for each gauge and in a summary table. If you have data, please let us know.
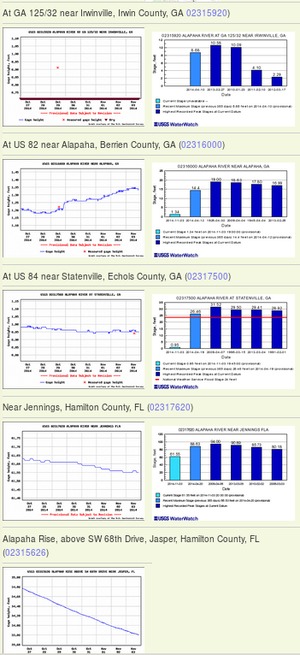
Here are water level gauges for the Alapaha River in Georgia and Florida, north to south. The graphs should show the current levels at this time, in feet, plus for most of the gauges a bar graph of selected historic levels.
This is a draft of a concept for use with the Alapaha River Water Trail. See also Alapaha River Rainy Season.
It is also a companion to the similar set of graphs for the Withlacoochee and Little Rivers.
See below for the current Alapaha River water level graphs.
Update 2014-11-04: Simplified gauge formatting.
Summary Water Level Table
See the levels for each gauge below, which are taken from the ARWT spreadsheet.Irwinville Gauge, Alapaha River at GA 125/32 near Irwinville, GA, Irwin County, GA (02315920)
Highest safe 5.9 feet, 268 NAVD. Lowest boatable 1.8 feet, 263.9 NAVD.
Alapaha Gauge, Alapaha River near Alapaha, GA, Berrien County, GA (02316000)
Highest safe 10.6 feet, 218.2 NAVD. Lowest boatable 7.7 feet, 215.3 NAVD.
Statenville Gauge, Alapaha River at Statenville, GA, Echols County, GA (02317500)
Highest safe 10.0 feet, 86.1 NAVD. Lowest boatable 2.0 feet, 78.1 NAVD.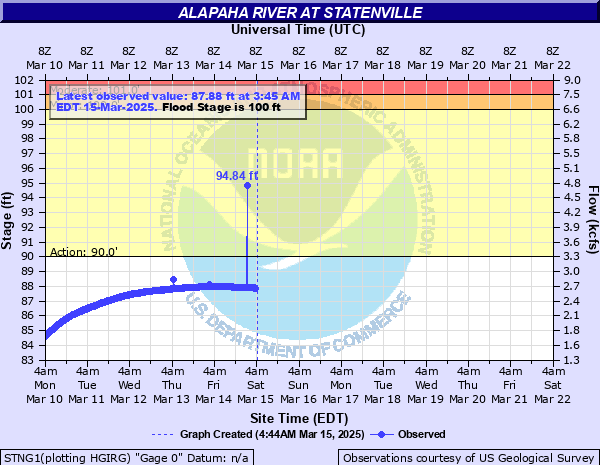
Jennings Gauge, Alapaha River near Jennings, FL, Hamilton County, FL (02317620)
Highest safe 7.4 feet, 68 NAVD. Lowest boatable 4.4 feet, 65 NAVD.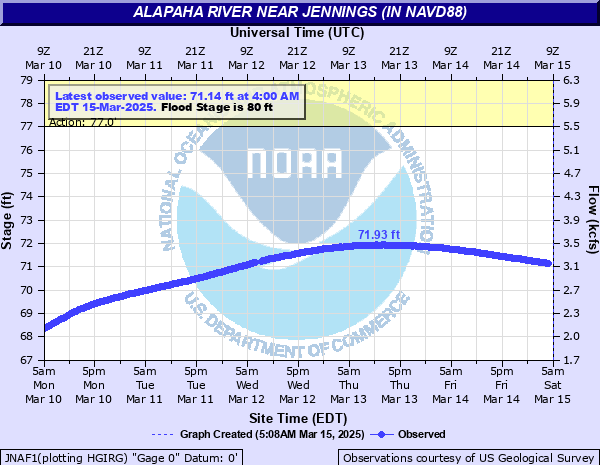
Irwinville, Alapaha, Statenville composite graph
Follow this link.
Maps
See interactive map.
Sources


- South Atlantic Water Science Center – Georgia.
- USGS Streamflow for Georgia and Florida.
- SRWMD water levels.
- NOAA USGS National Water Prediction Service
-jsq, John S. Quarterman, Suwannee RIVERKEEPER®
You can help with clean, swimmable, fishable, drinkable, water in the 10,000-square-mile Suwannee River Basin in Florida and Georgia by becoming a WWALS member today!
https://wwals.net/donations/
Short Link:
Pingback: Flooding charts - WWALS Watershed Coalition
Pingback: Alapaha River Water Levels - Our Santa Fe River, Inc., a 501 (c) (3) Non-Profit Florida Corporation