
Update 2020-01-30: Videos.
Update 2020-01-05: Earlier this same Wednesday: Florida Sen. Bill Montford hosting Valdosta sewage public meeting in Madison, FL 2020-01-08.
A Special Called Meeting of the Valdosta City Council, about Valdosta’s record-largest raw sewage spill in December 2019, and what to do going forward. Attendees will include the North Central Florida Regional Planning Council (presumably its Task Force on this subject), and apparently GA-EPD, EPA, FDEP, SRWMD, and of course Suwannee Riverkeeper. It is a public meeting, so anyone can attend. If it’s run like previous such meetings, anyone can ask questions. We have plenty. I hope you do, too.
When: 6 PM, Wednesday, January 8, 2020
Where: General Purpose Room, Valdosta City Hall Annex, 300 North Lee Street, Valdosta, GA 31601
Event: facebook
Continue reading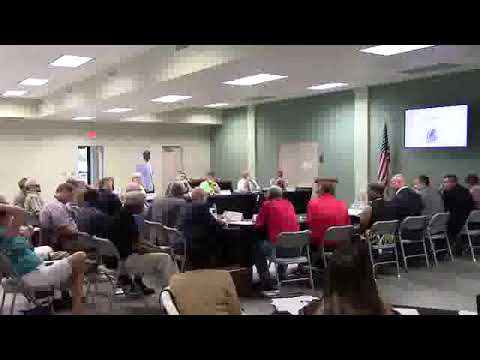
![[Early (12/10-12/18)]](https://www.wwals.net/pictures/2019-01-01--ga-fl-wq-vld-sewage/0early.jpg)
![[Knights Ferry Boat Ramp]](https://www.wwals.net/pictures/2019-12-24--kf-wq/20191225_180148_resized.jpg)
![[Green at the Confluence]](https://www.wwals.net/pictures/2019-12-21--little-river-withlacoochee-spook-bridge/79795836_3099030763445582_4344053137196187648_o.jpg)
![[Sugar Creek via Ga 133 to US 84]](https://www.wwals.net/pictures/2019-12-17--wq-testing-ga-133-withlacoochee/map.jpg)
![[Knights Ferry & State Line Ramps]](https://www.wwals.net/pictures/2019-12-21--little-river-withlacoochee-spook-bridge/20191222_190617_resized.jpg)
![[Skipper Bridge Gauge, Withlacoochee, above Valdosta, 2019-12-22, 7:30 AM]](https://www.wwals.net/pictures/2019-12-22--skipper-bridge-vld-sewage/vdsg1_hg.jpg)
![[Florida Health Advisory on kiosk]](https://www.wwals.net/pictures/2019-12-16--wq-testing-fl-campsites-us84/20191216_143924.jpg)
![[Looking down]](https://www.wwals.net/pictures/2019-12-16--wq-testing-fl-campsites-us84/20191216_165346.jpg)
![[Testing locations]](https://www.wwals.net/pictures/2019-12-16--vld-sewage-release/12-16-2019-SitRep--Valdosta-Sewage-Release_html_b3d0ecfa68756e3d.jpg)
